This post is part of a series on developing Apps for Office 2013. Before we dive into creating the various Apps for Office examples, we should briefly review how you can use Visual Studio and your browser tools to debug issues and errors in your apps.
Debugging Code: Just Hit F5
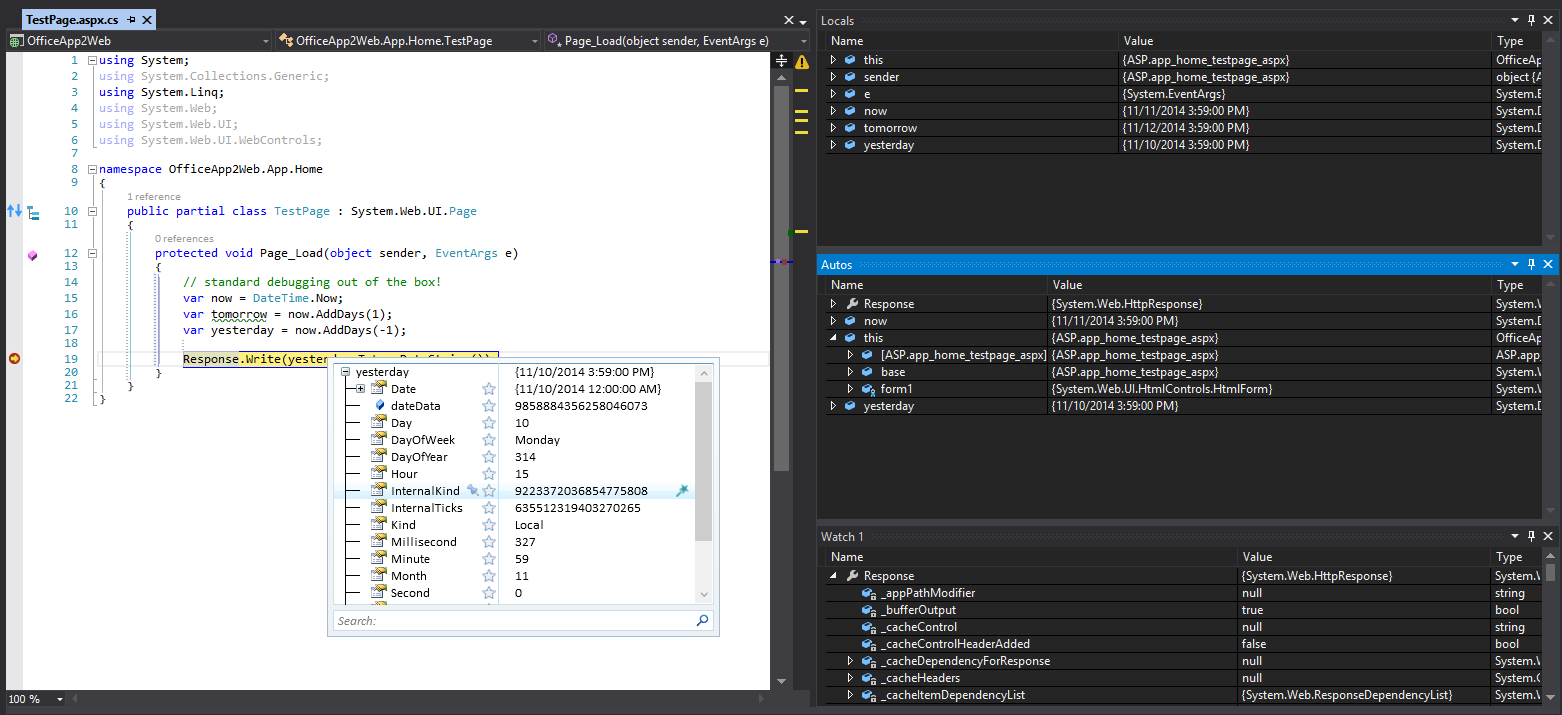
Visual Studio extends its powerful debugging tools to Apps for Office, allowing you to simply hit F5 to launch both the specified Office application as well as the associated Web site that contains the actual app. Since this ultimately is a standard web site under the covers, you get the same server-side debugging as any other project such as ASP.NET Webforms or MVC.
Simply set a breakpoint on the server side code and Visual Studio will automatically attach, allowing you to step through just as you would with any other site, including full support for Autos, Locals, and Watch windows.
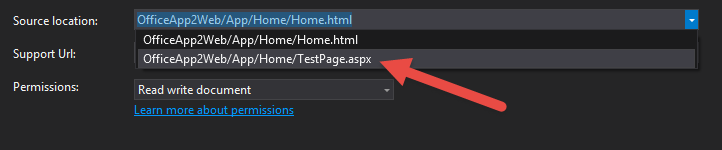
Note: by default, the Visual Studio template for Apps for Office generates a standard html file with no server-side code. However, you can add any web form (or ASP.NET controller, view, etc.) and define the startup page in the App Manifest.
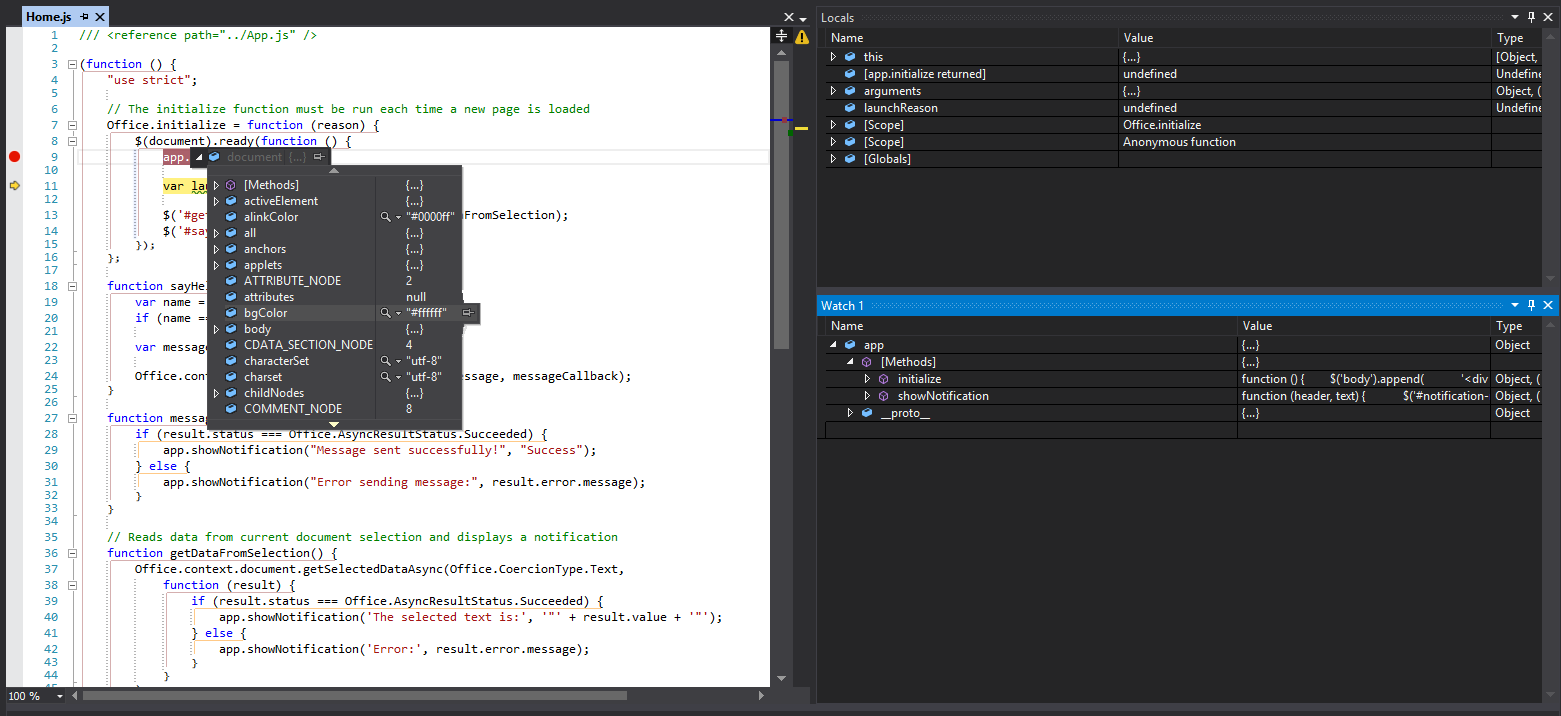
These tools are not limited only to the server-side; Visual Studio�s powerful client-side JavaScript debugging is also fully supported. This allows you to easily debug and step through JavaScript code while including support for watch variables and even Data Tips to see the properties of the JavaScript objects in your code by hovering over them.
The debugging tools offered by Visual Studio are certainly powerful, but only represent one of many tools available to developers creating Apps for Office. As you no doubt already realize, although Apps for Office run as web sites inside of a browser, that browser actually renders inside a frame within the Office application. As a result, it�s difficult to inspect and review markup, layout, and styling issues. Here are some of the tools available to help.
Page Inspector
If you are a .NET web developer you are probably already familiar with the Page Inspector, which is a fantastic tool for visually inspecting how a page will render without having to leave Visual Studio. Again, because Apps for Offices are simply web sites, you are able to use this helpful feature to see a live version of the markup in real-time against your markup and code.
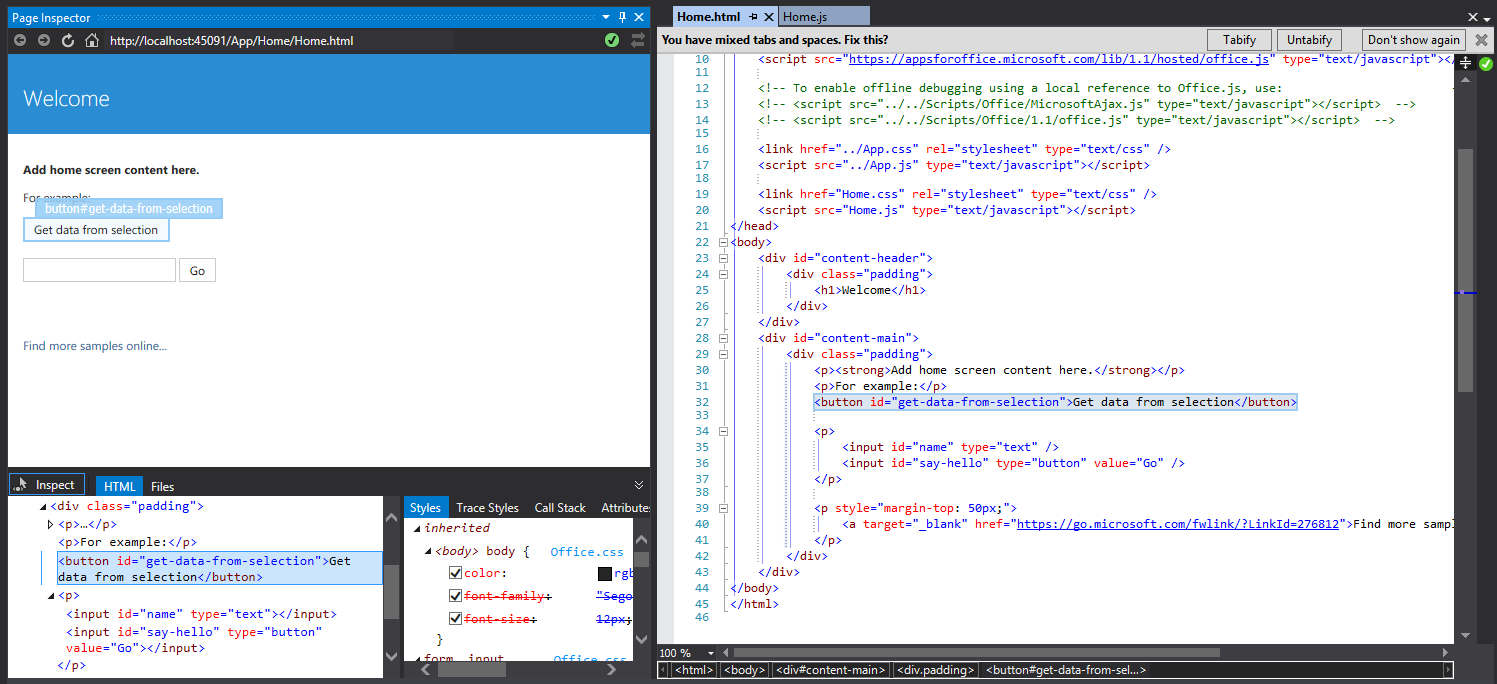
Any selections made with the Inspector tool are immediately synchronized in the Page Inspector itself, the HTML DOM and CSS definitions below, as well as your source HTML file, allowing you to trace elements and issues with the click of a button. Changes made to your source are then immediately reflected in the inspector, allowing you to fix errors on the fly without having to launch and refresh the application.
DOM Explorer
In addition to tracing the rendered page back to your source HTML and CSS at design time, the DOM Explorer feature of Visual Studio allows you to perform similar inspection of the page while the app is running live inside Office.
Once you launch your app, simply toggle back to Visual Studio and from the Debug menu select Windows > DOM Explorer and then select the appropriate page from the menu.
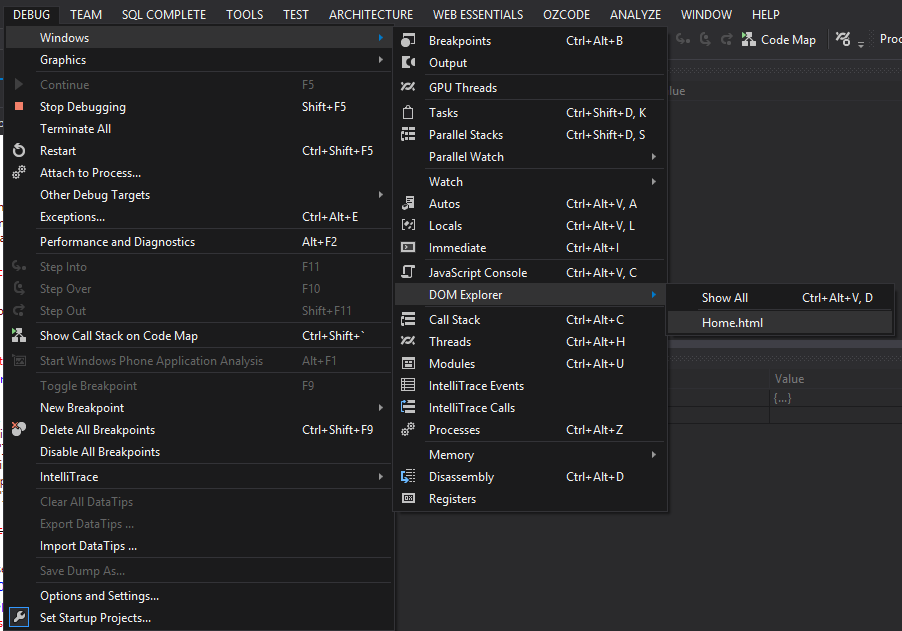
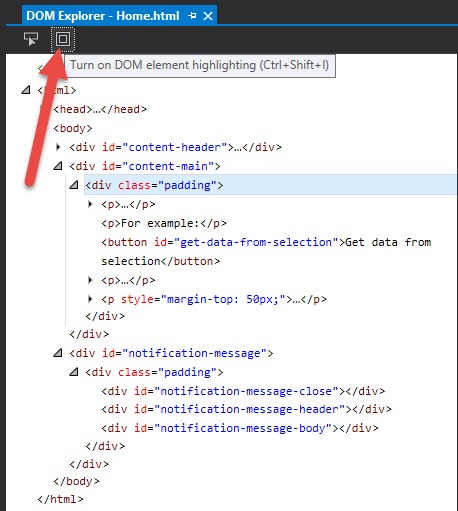
This will reveal the DOM Explorer for the selected page, with similar tools for inspecting and tracing markup and style.
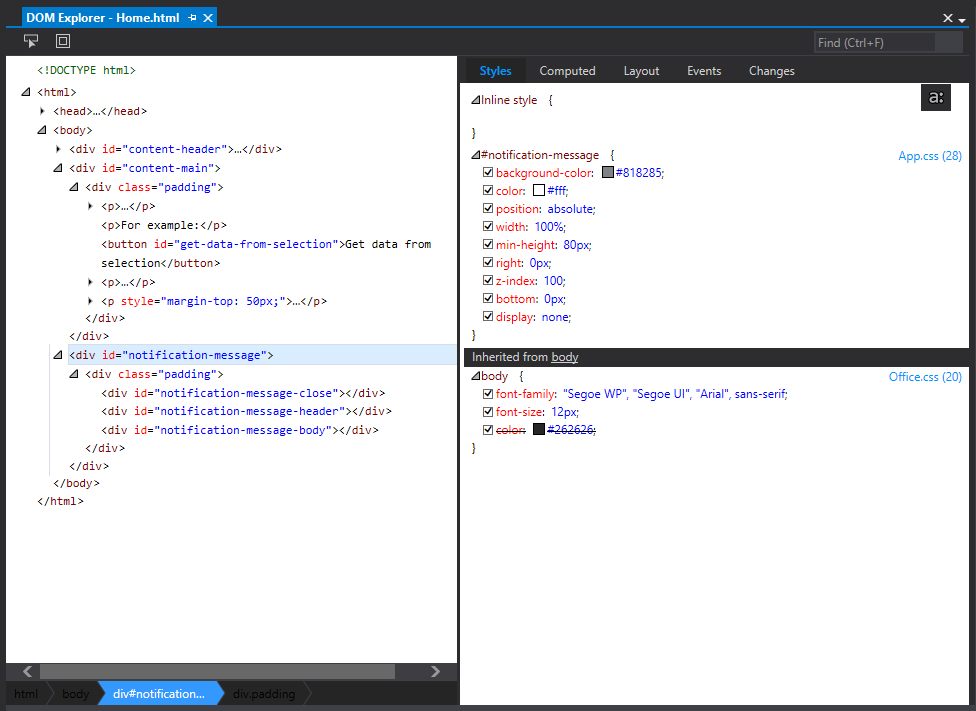
The difference between these tools is that while the Page Inspector renders a preview of the HTML in your source, the DOM Explorer represents the live rendered HTML of the page that is running in the app. This means if you have dynamic elements such as lists, or as in the case of the sample app generated by the Visual Studio template, a dynamic notification area (selected in the image above), you will see it rendered fully in the HTML. This is helpful for debugging layout and style issues that only appear dynamically in the live app.
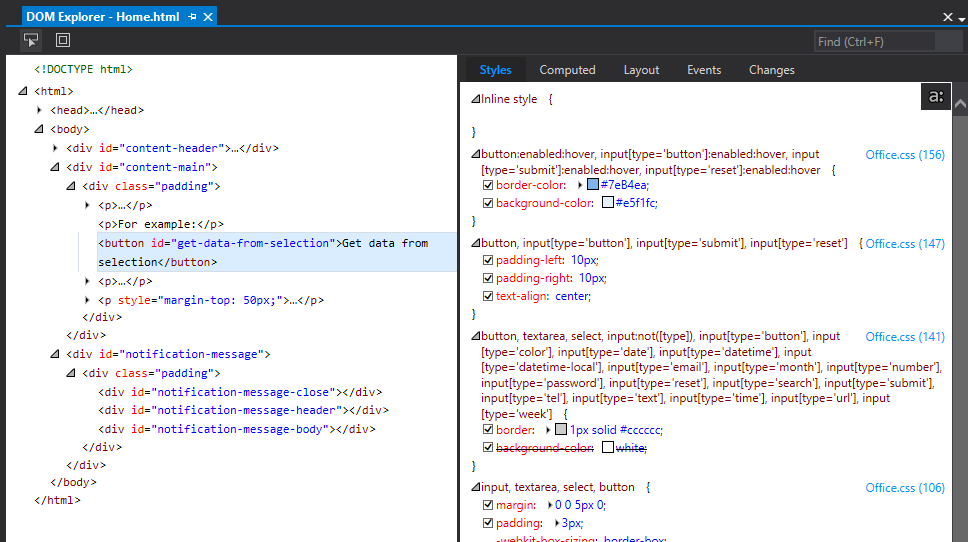
Just like the Page Inspector, there is an inspector tool button, which when selected allows you to focus elements, this time in the live app. Any selections you make will then be automatically highlighted in the DOM Explorer. �
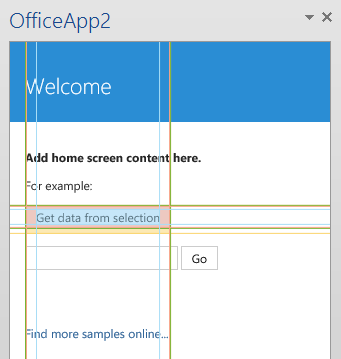
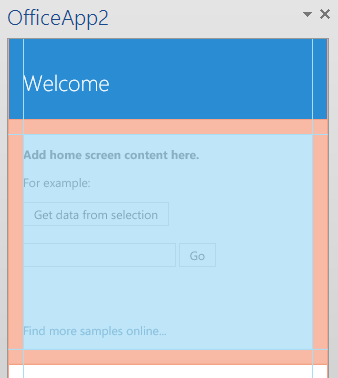
The DOM Explorer has another helpful tool called Element Highlighting. By toggling this option, any selection made in the explorer will also be highlighted in the App. This makes it easier to identify and focus problematic areas. �
Any changes made in the DOM Explorer will automatically update on the live app. However, remember that here you are updating the live rendering of the app, not the original HTML, so these changes will NOT automatically be saved to the original source file.
We�ve now seen two ways to troubleshoot style and layout issues in your app, both at design and runtime. But what about identifying and debugging JavaScript issues?
JavaScript Console
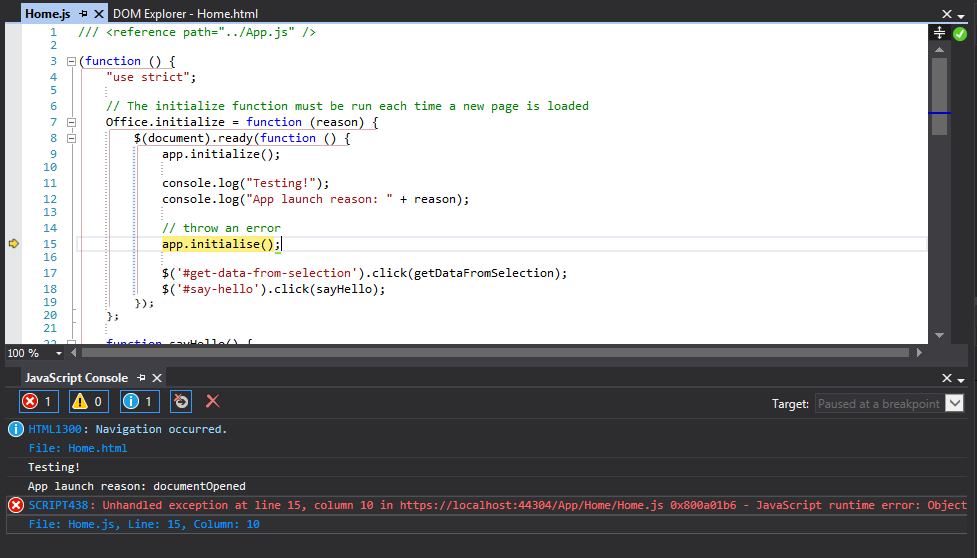
Fortunately Visual Studio once again has you covered with the JavaScript Console, which can be used to review logged events and errors that occur within your app. This feature is also available in the Debug menu, but only when the app is running.
Just like the console available in the developer tools of most browsers, the JavaScript console can be used to log events and receive immediate feedback when they occur, as well as capture and output any errors that occur during execution.
These three tools, together with the default server and client side debugging features of Visual Studio, give you a powerful environment to develop, test, and debug your apps.
But what if you really need a feature from one of the browsers such as the Chrome Developer Tools or browser add-ons such as Web Developer Tools and Kendo UI Chrome Inspector?
While Apps for Office do require the Office application to be loaded and run, it is possible to temporarily modify your project to allow it to run in the browser. When all else fails, this can be a useful option for additional debugging resources.
Debugging in the Browser
As we continue to mention, Apps for Office are, deep down, simply web sites. So it is reasonable to expect that we should be able to preview and launch them in the browser. However, the apps do rely heavily on the host Office application. In fact, the initialization code will not fire unless the app is loaded within Office.
Fortunately we can make some temporary changes to disable the Office integration and allow the app to run as a regular website by following these steps:
Comment or remove the Office.initialize method from the JavaScript code for your app. This will prevent the error of the app attempting to initialize itself in the now missing host Office application
Comment or remove the reference to the Office.js API. The generated sample app includes both a local reference (already commented out by default) and the live CDN of the API. Be sure both are disabled or removed or you will receive an error as they attempt to initialize inside the missing Office context.
Comment or remove out any references to the Office API methods.
Take special note of step 3 above. Because you no longer have a reference to the host Office application or API, the API methods and objects are no longer defined, so attempting to use them will result in errors.
If you need to debug issues with the Office API, the Visual Studio JavaScript console is the way to go. However, if you have already eliminated Office as a possible source of the issue, and need to test only the HTML in isolation, this is a great way to do so.
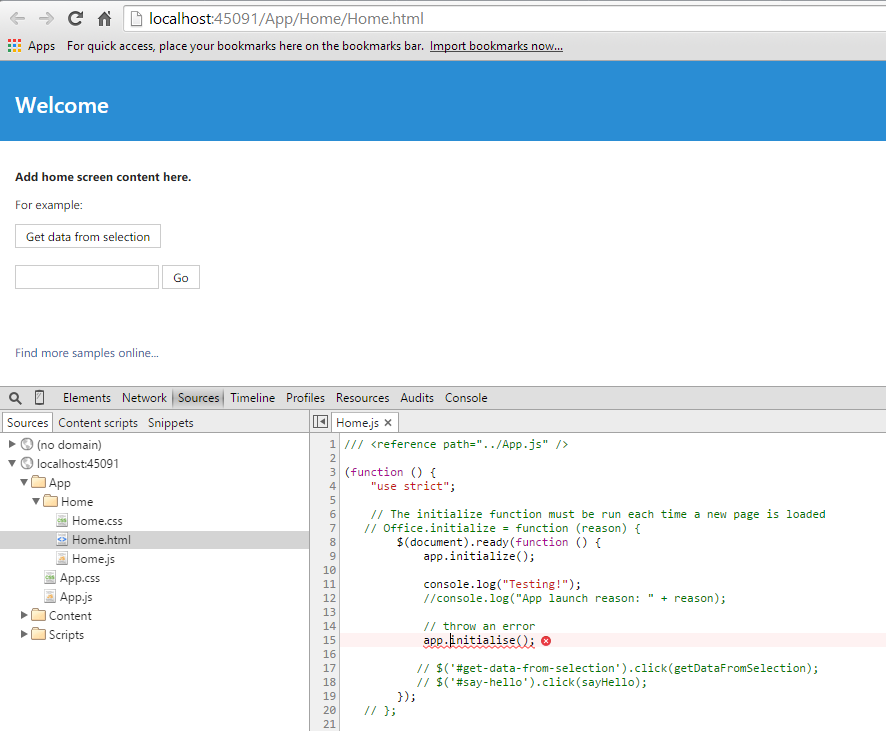
Once you have removed all references to the Office app and API, you can right-click the project (or a web page within the project) and select the option to View in Browser. This will launch the Visual Studio web server and serve the page as a regular web site, giving you full access to the entire suite of browser tools and extensions to troubleshoot any issues.
Wrapping Up and Next Steps
Visual Studio is a powerful platform for developing, testing, and debugging web sites both on the server and client side. Apps for Office take full advantage of this tooling, exposing several of the web tools to help troubleshoot issues during both the design and execution of your application. In addition, because you are simply building web sites, you can always remove the references temporarily to utilize additional resources available only in your favorite browser. Now that we have a solid understanding of the tools at our disposal, we can dive in and start building! In our next few posts we�ll build a few real-world apps, starting with the Task Pane App. Please share your questions, comments, and Apps for Office topic requests below.